Cattle Lameness Detection System
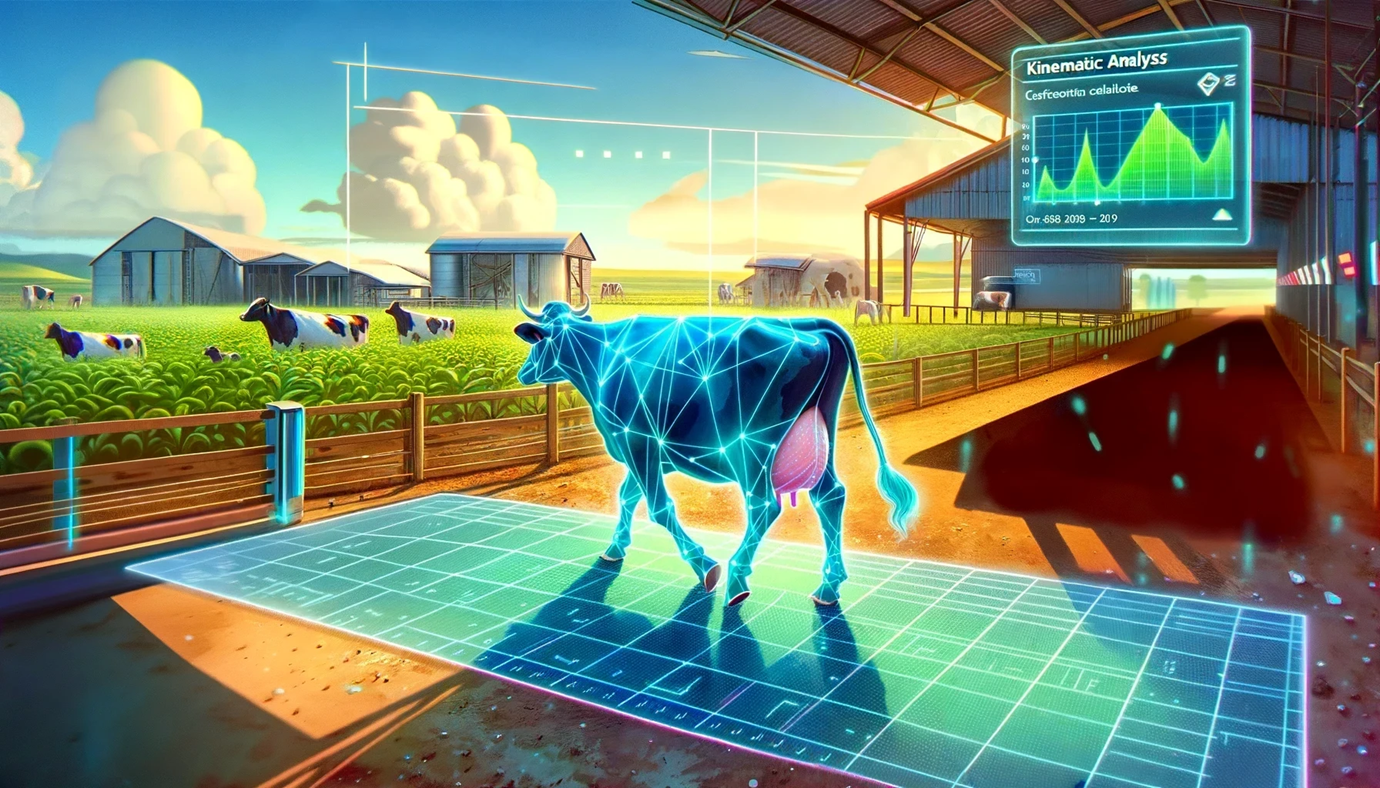
End-to-end video analysis system for automated cattle lameness detection using computer vision and biomechanical feature extraction.
Problem & Context
Lameness is one of the most impactful health and welfare issues in dairy production. Early detection can reduce suffering, improve treatment outcomes, and prevent productivity losses—yet practical, scalable monitoring remains difficult in routine farm operations.
Human locomotion scoring is a widely used reference but can be time-consuming and subject to inter-rater variability. Real-world recordings also introduce variability (illumination, occlusions, changing backgrounds, non-standardized walking paths), which complicates reproducible assessment. This project focuses on building an objective, deployable pipeline that can operate under these conditions using standard video.
Design Goals
- •Objective measurements from ordinary video
- •Robustness to missing/low-confidence keypoints
- •Traceable and reproducible analysis (from video → keypoints → features → predictions)
- •Deployment-ready: cloud inference and edge operation
System Overview
The core idea is to avoid 'black-box scoring' by reporting intermediate artifacts and quality flags. This supports scientific validation and practical field use.
Capture
Input is a short walking video segment. Videos can be processed as segments and frames to preserve traceability and enable quality checks.
Analyze
Keypoints are detected, quality metrics are computed, and biomechanical features are extracted (angles, curvature, straightness, temporal summaries).
Output
The system returns an estimated locomotion status (healthy vs. non-healthy) and optional severity prediction, along with a QA summary that explains data reliability.
Pipeline Architecture
Pipeline stages: 1. Video ingestion and segmentation 2. Keypoint estimation (pose/landmark detection) 3. Data Quality Assurance (QA) per segment/frame 4. Feature engineering (back-shape + temporal statistics) 5. Model inference (binary and/or severity) 6. Reporting layer (prediction + QA summary + optional visual overlays) Why modular? • Enables switching between detectors or models without rewriting the whole system • Supports consistent evaluation and debugging • Makes cloud vs. edge deployment a configuration choice The same modular stages can run in the cloud (serverless GPU inference) or on an edge device, depending on operational constraints.
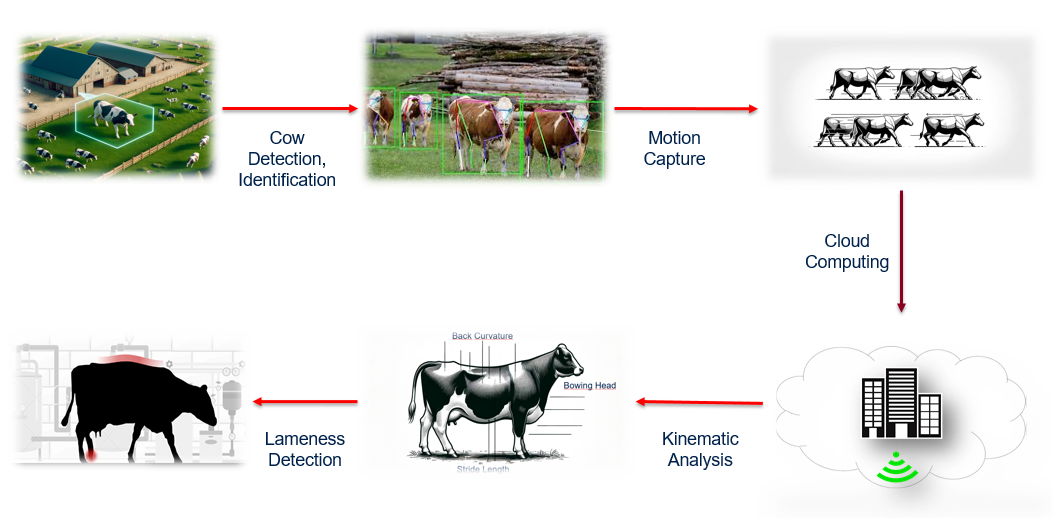
Pipeline Architecture Diagram showing cow detection, motion capture, kinematic analysis, and lameness detection workflow
Data & Labeling
Ground-truth locomotion scores (LCS) are provided by veterinary professionals during locomotion recording sessions. These labels form the reference standard for training and evaluation.
To preserve interpretability, the pipeline keeps track of the full path from raw videos to per-frame keypoints and aggregated features. This structure supports later analyses such as rater agreement studies and comparisons between human scores and automated outputs.
Data Storage
- •Raw video reference (segment identifier)
- •Per-frame keypoints + confidence scores
- •QA metrics (missing/outlier/completeness)
- •Engineered features (angles/curvature/straightness; temporal summaries)
- •Final prediction outputs and logs
Keypoint Estimation & QC
Segments are categorized into High / Medium / Low quality tiers based on QA thresholds. Training and strict validation can be restricted to high-quality segments, while lower tiers can be used for robustness checks or excluded depending on the experiment.
Quality Metrics
- •Missing ratio: proportion of missing/invalid keypoints within a segment
- •Outlier ratio: proportion of frames flagged as outliers (sliding-window based) before/after interpolation
- •Complete-frame ratio: fraction of frames that pass completeness criteria for the required keypoints
- •Confidence filtering: keypoints below a probability threshold are treated as unreliable
Feature Engineering
The feature set focuses on back-shape descriptors and temporal summaries that can capture posture and movement patterns associated with locomotion impairment. Features are computed per frame and then aggregated to represent each video segment robustly.
Back Shape Features
- •Region-wise angles along the back (cranial / middle / caudal regions)
- •Curvature and straightness measures derived from keypoint geometry
- •Robust handling of animal position changes via reference points and relative geometry where appropriate
Temporal Features
- •Mean, standard deviation, minimum, maximum, and range across frames
- •Optional window-based summaries for capturing short-term dynamics
- •Consistent scaling and feature normalization for model training
Modeling & Validation
Modeling is designed to reflect practical decision-making. A common setup is a two-stage approach: first classify healthy vs. non-healthy locomotion, then estimate severity among non-healthy classes (e.g., LCS 2–4). This structure can be implemented with classical models (e.g., tree-based methods) or neural classifiers depending on the experiment.
Generalization is evaluated using cross-validation and careful separation of training and testing. Class imbalance is addressed via resampling strategies. Importantly, model outputs are interpreted alongside keypoint error and QA summaries to avoid overconfidence on low-quality samples.
Modeling Principles
- •Cross-validation for generalization estimation
- •Class imbalance handling (resampling / stratified splits)
- •Report both prediction performance and data reliability indicators
- •Compare automated outputs against expert scores, and analyze disagreements qualitatively
Deployment & Operations
A key goal is deployability. The system is designed to run either as cloud inference (serverless GPU endpoints) or as an on-farm edge pipeline. The modular architecture supports reproducible builds via containerization and structured logging for field operation.
Cloud Mode
- •Serverless GPU inference for keypoint estimation and model prediction
- •Web-based user experience: upload → analyze → report
- •Versioned pipelines and reproducible environments
Edge Mode
- •Real-time camera processing pipeline using GStreamer
- •Trigger-based recording workflows (e.g., detection-based or RFID-based triggers)
- •Resource-aware operation (CPU/GPU sharing)
Results Snapshot
This section summarizes the artifacts typically produced for a validation-ready report. Final values depend on dataset split and quality tier selection, and should be interpreted alongside QA metrics.
Key Artifacts
- •QA distribution across samples (High/Medium/Low)
- •Example prediction breakdown by LCS group
- •Confusion matrix and per-class metrics
- •Example visual overlay of keypoints/back geometry on video frames
Limitations & Next Steps
Key limitations include domain shift between farms and recording setups, as well as reduced reliability under severe occlusion or poor illumination. Even strong models can degrade when the input distribution changes.
Next Steps
- •Multi-farm validation and robustness evaluation
- •Uncertainty estimation to flag low-confidence predictions
- •Active learning to prioritize difficult cases for labeling
- •Improved augmentation and detector robustness for challenging conditions
- •Extending the report layer with richer explainability (feature contributions, QA overlays)
Problem & Context
Lameness is one of the most impactful health and welfare issues in dairy production. Early detection can reduce suffering, improve treatment outcomes, and prevent productivity losses—yet practical, scalable monitoring remains difficult in routine farm operations.
Human locomotion scoring is a widely used reference but can be time-consuming and subject to inter-rater variability. Real-world recordings also introduce variability (illumination, occlusions, changing backgrounds, non-standardized walking paths), which complicates reproducible assessment. This project focuses on building an objective, deployable pipeline that can operate under these conditions using standard video.
Design Goals
- •Objective measurements from ordinary video
- •Robustness to missing/low-confidence keypoints
- •Traceable and reproducible analysis (from video → keypoints → features → predictions)
- •Deployment-ready: cloud inference and edge operation
System Overview
The core idea is to avoid 'black-box scoring' by reporting intermediate artifacts and quality flags. This supports scientific validation and practical field use.
Capture
Input is a short walking video segment. Videos can be processed as segments and frames to preserve traceability and enable quality checks.
Analyze
Keypoints are detected, quality metrics are computed, and biomechanical features are extracted (angles, curvature, straightness, temporal summaries).
Output
The system returns an estimated locomotion status (healthy vs. non-healthy) and optional severity prediction, along with a QA summary that explains data reliability.
Data & Labeling
Ground-truth locomotion scores (LCS) are provided by veterinary professionals during locomotion recording sessions. These labels form the reference standard for training and evaluation.
To preserve interpretability, the pipeline keeps track of the full path from raw videos to per-frame keypoints and aggregated features. This structure supports later analyses such as rater agreement studies and comparisons between human scores and automated outputs.
Data Stored
- •Raw video reference (segment identifier)
- •Per-frame keypoints + confidence scores
- •QA metrics (missing/outlier/completeness)
- •Engineered features (angles/curvature/straightness; temporal summaries)
- •Final prediction outputs and logs
Keypoint Estimation & QC
Quality Metrics
- •Missing ratio: proportion of missing/invalid keypoints within a segment
- •Outlier ratio: proportion of frames flagged as outliers (sliding-window based) before/after interpolation
- •Complete-frame ratio: fraction of frames that pass completeness criteria for the required keypoints
- •Confidence filtering: keypoints below a probability threshold are treated as unreliable
Feature Engineering
The feature set focuses on back-shape descriptors and temporal summaries that can capture posture and movement patterns associated with locomotion impairment. Features are computed per frame and then aggregated to represent each video segment robustly.
Back Shape
- •Region-wise angles along the back (cranial / middle / caudal regions)
- •Curvature and straightness measures derived from keypoint geometry
- •Robust handling of animal position changes via reference points and relative geometry where appropriate
Temporal
- •Mean, standard deviation, minimum, maximum, and range across frames
- •Optional window-based summaries for capturing short-term dynamics
- •Consistent scaling and feature normalization for model training
Modeling & Validation
Modeling is designed to reflect practical decision-making. A common setup is a two-stage approach: first classify healthy vs. non-healthy locomotion, then estimate severity among non-healthy classes (e.g., LCS 2–4). This structure can be implemented with classical models (e.g., tree-based methods) or neural classifiers depending on the experiment.
Generalization is evaluated using cross-validation and careful separation of training and testing. Class imbalance is addressed via resampling strategies. Importantly, model outputs are interpreted alongside keypoint error and QA summaries to avoid overconfidence on low-quality samples.
Principles
- •Cross-validation for generalization estimation
- •Class imbalance handling (resampling / stratified splits)
- •Report both prediction performance and data reliability indicators
- •Compare automated outputs against expert scores, and analyze disagreements qualitatively
Deployment & Operations
A key goal is deployability. The system is designed to run either as cloud inference (serverless GPU endpoints) or as an on-farm edge pipeline. The modular architecture supports reproducible builds via containerization and structured logging for field operation.
Cloud
- •Serverless GPU inference for keypoint estimation and model prediction
- •Web-based user experience: upload → analyze → report
- •Versioned pipelines and reproducible environments
Edge
- •Real-time camera processing pipeline using GStreamer
- •Trigger-based recording workflows (e.g., detection-based or RFID-based triggers)
- •Resource-aware operation (CPU/GPU sharing)
Results Snapshot
This section summarizes the artifacts typically produced for a validation-ready report. Final values depend on dataset split and quality tier selection, and should be interpreted alongside QA metrics.
Artifacts
- •QA distribution across samples (High/Medium/Low)
- •Example prediction breakdown by LCS group
- •Confusion matrix and per-class metrics
- •Example visual overlay of keypoints/back geometry on video frames
Limitations & Next Steps
Key limitations include domain shift between farms and recording setups, as well as reduced reliability under severe occlusion or poor illumination. Even strong models can degrade when the input distribution changes.
Next Steps
- •Multi-farm validation and robustness evaluation
- •Uncertainty estimation to flag low-confidence predictions
- •Active learning to prioritize difficult cases for labeling
- •Improved augmentation and detector robustness for challenging conditions
- •Extending the report layer with richer explainability (feature contributions, QA overlays)
Implementation Challenges
- •Handling variable lighting conditions and occlusions in farm environments
- •Real-time processing requirements for practical deployment
- •Domain adaptation across different recording setups
- •Integrating with existing farm management systems
Future Improvements
- •Multi-farm validation and robustness evaluation
- •Uncertainty estimation to flag low-confidence predictions
- •Active learning to prioritize difficult cases for labeling
- •Improved augmentation and detector robustness for challenging conditions
- •Extending the report layer with richer explainability